Measure portfolio financial health - cost per application, cost per capability, and wasted spend - Application Portfolio Management (APM) Best Practices
Measure portfolio financial health - cost per application, cost per capability, and wasted spend
(Chapter 174 of Application Portfolio Management (APM) Best Practices)
Executive Summary: Chapter Overview
IF4ITThe Bottom Line
Core Concepts
| Concept | Definition & Strategic Role |
|---|---|
| Portfolio Financial Health Metrics | The specific financial health metrics — cost per application, cost per business capability, wasted spend identified and eliminated, budget variance — that measure portfolio financial health in terms leadership acts on. |
| Trending and Comparison | The value of trending financial health metrics over time (portfolio cost trajectory, improvement in cost per capability, waste elimination trend) and comparing them against peer portfolios or benchmarks where available (portfolio cost as percentage of revenue, cost per employee). |
Quick Q&A
Question: What financial health metrics matter most for leadership?
Question: Why is waste identified and eliminated the metric leadership responds to most strongly?
Read More Below
Overview
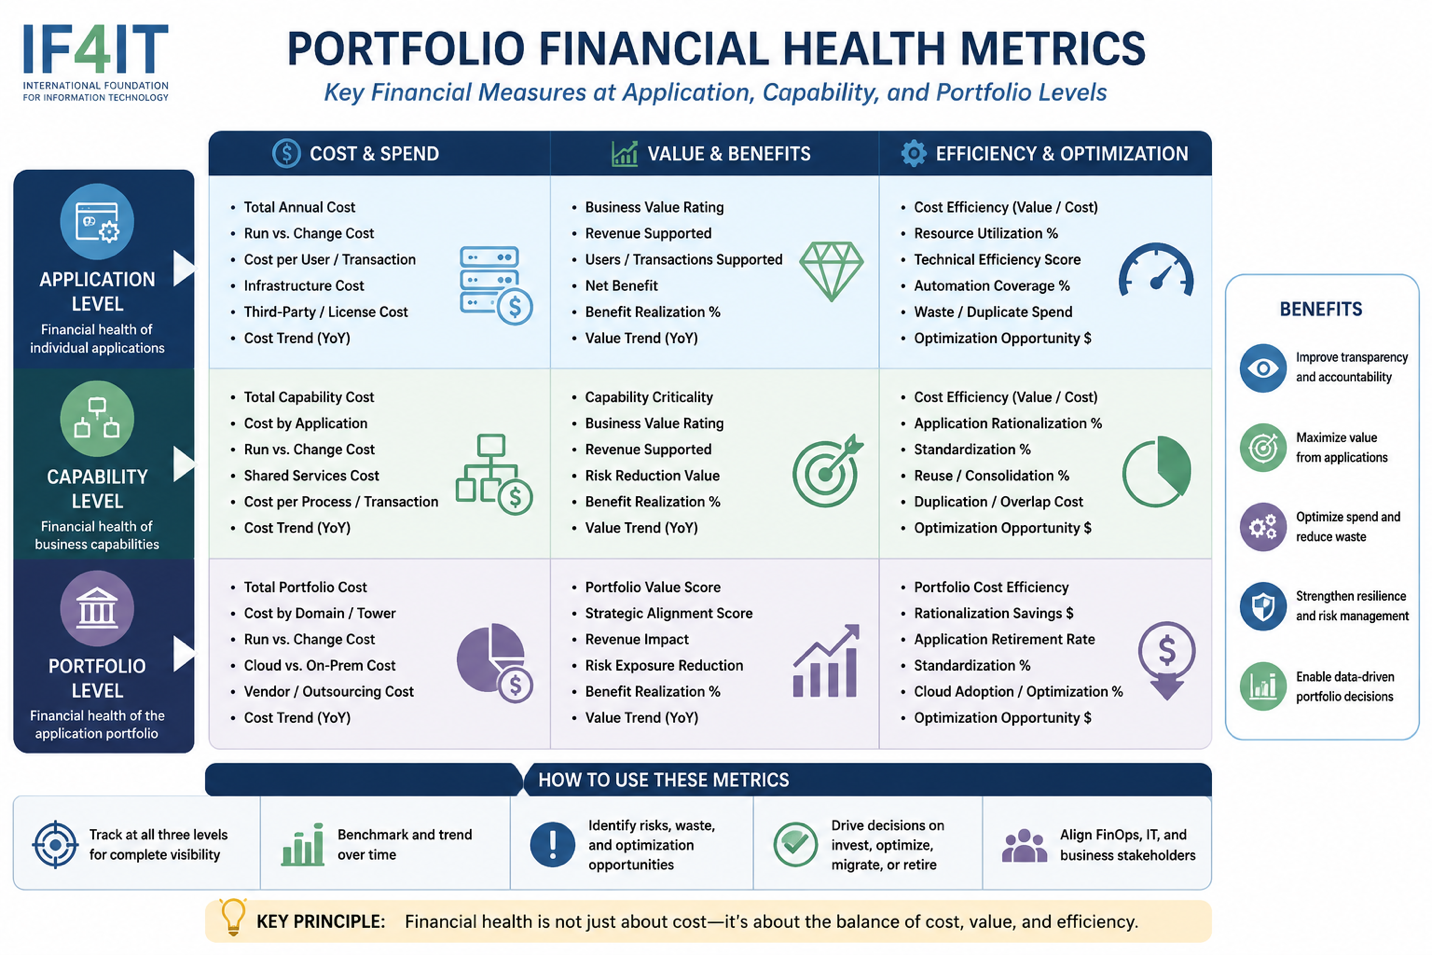
Portfolio financial health metrics translate the abstract concept of APM financial discipline into concrete, leadership-accessible indicators of how efficiently the organization is investing in its application portfolio. Cost per application tells the organization whether its portfolio is becoming more or less economically efficient as the number of managed applications changes through rationalization and new adoption. Cost per business capability served tells the organization whether its technology investment is aligned with the business capabilities that create value. Wasted spend identified and eliminated tells the organization whether its APM investment is generating measurable financial returns that justify its cost.
Best Practice
Calculate and track portfolio financial health metrics on a quarterly basis as a standard element of portfolio governance reporting. Total cost per active application provides the baseline efficiency metric - track the trend over time and assess whether rationalization is reducing per-application cost or whether new adoption is offsetting the savings from retirements. Cost per active business capability served provides the strategic alignment metric - compare costs across capabilities to identify capabilities that are served by disproportionately expensive application portfolios and capabilities where underinvestment may be creating performance risk. Wasted spend eliminated provides the return-on-investment metric - track cumulatively and annually the specific financial savings generated through license optimization, subscription rationalization, redundancy elimination, and infrastructure right-sizing attributable to APM program activities.
Benefit(s)
Portfolio financial health metrics provide the quantified evidence that demonstrates APM’s organizational value in the financial terms that leadership finds most compelling and most actionable. Cost per application trends reveal whether the portfolio is becoming more economically efficient over time or whether new application adoption is outpacing rationalization savings. Cost per capability reveals misalignments between technology investment and business value creation that narrative analysis alone cannot surface with the specificity that financial evidence provides. Wasted spend elimination provides the most direct financial return-on-investment evidence available - specific, attributable savings that justify the APM program’s cost and make the case for continued and expanded investment.
How to cite this page
When referencing this page in academic work, internal standards, or external publications, include the page title, IF4IT as author and publisher (The International Foundation for Information Technology (IF4IT), LLC), the URL, and your access date.
Example (informal web citation):
The International Foundation for Information Technology (IF4IT), LLC. Measure portfolio financial health - cost per application, cost per capability, and wasted spend | Application Portfolio Management (APM) Best Practices. https://if4it.org/best-practices/application-portfolio-management-apm/measure-portfolio-financial-health-cost-per-application-cost-per-capability-and-wasted-spend/ (accessed 2026-09-08).
See About Us for content governance and site-wide citation guidance.
Copyright for The International Foundation for Information Technology (IF4IT), LLC: 2008 - Present
Legal Disclaimers