Use Integration and Technology Diversity Signals to Derive Order-of-Magnitude Complexity and Cost Scores - Application Portfolio Management (APM) Best Practices
Use Integration and Technology Diversity Signals to Derive Order-of-Magnitude Complexity and Cost Scores
(Chapter 67 of Application Portfolio Management (APM) Best Practices)
Executive Summary: Chapter Overview
IF4ITThe Bottom Line
Core Concepts
| Concept | Definition & Strategic Role |
|---|---|
| Integration-Derived Complexity Signal | The relationship between an application’s number, type, and protocol of Integrations and its likely change, retirement, and operational complexity — more integrations, and more complex integration types, directionally indicate higher complexity and cost. |
| Technology-Diversity Signal | The relationship between the number and diversity of an application’s underlying technologies — for example, three different database types in a persistence polyglot versus a single database — and its likely complexity and cost, captured through the Technology Profile attributes already governed in the Technologies Inventory. |
Quick Q&A
Question: How do Integrations specifically drive an Order-of-Magnitude complexity or cost tier?
Question: Why does technology diversity, like a persistence polyglot, indicate higher complexity?
Question: How should Integration and technology-diversity signals be combined into a single OoM tier?
Read More Below
Overview
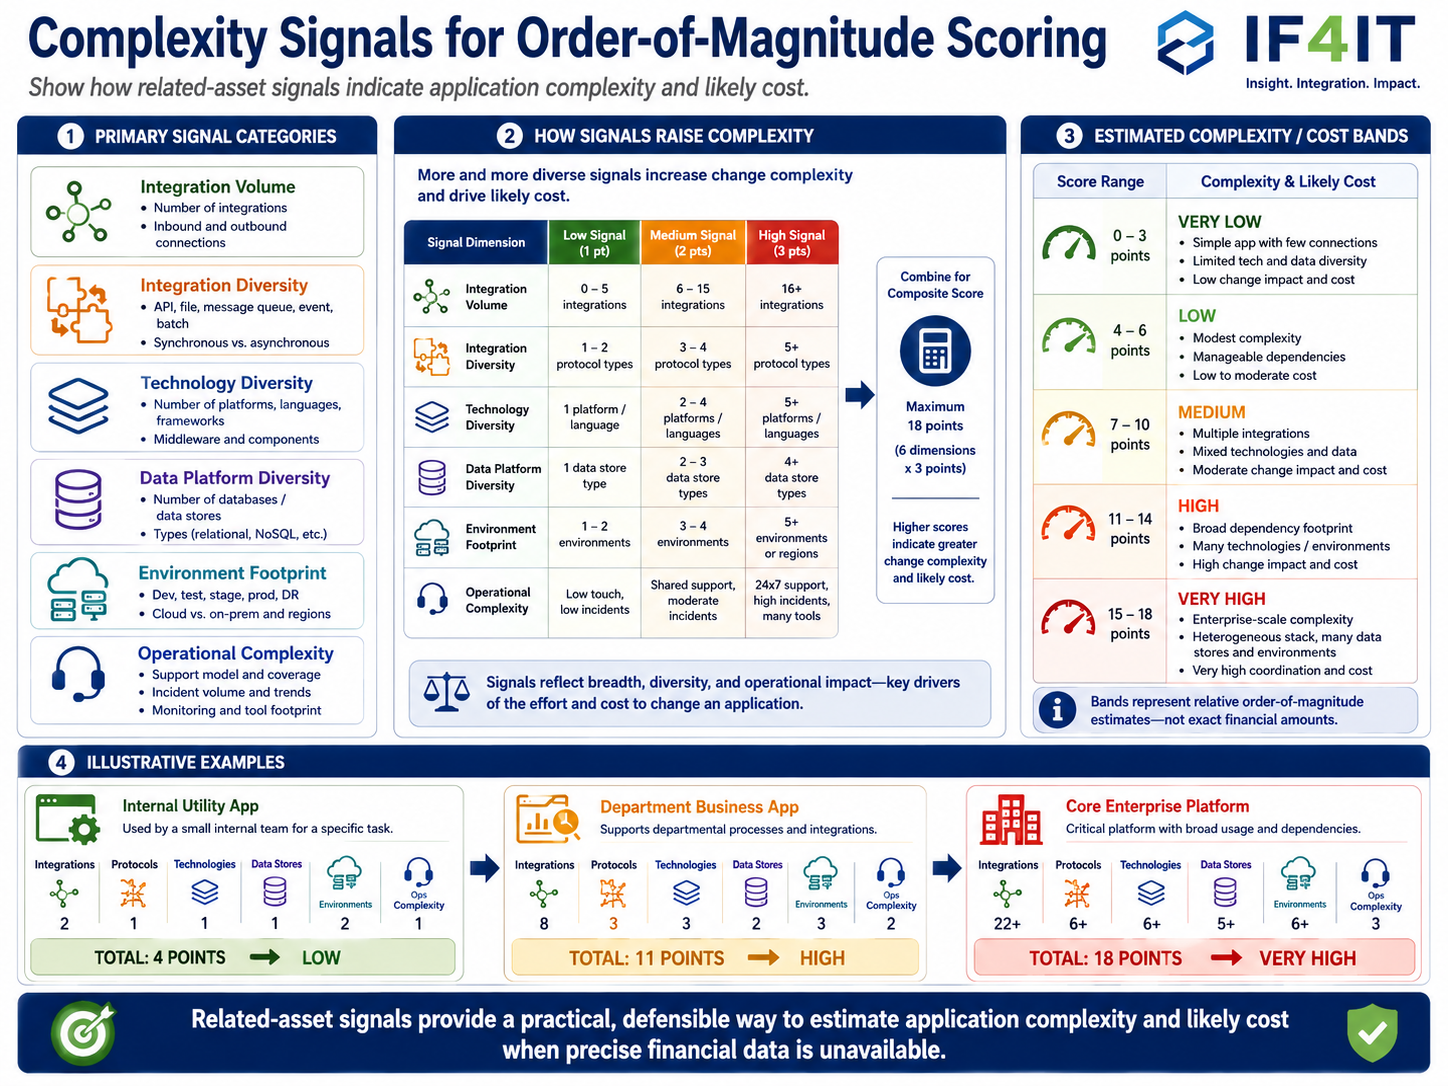
The chapter that establishes Order-of-Magnitude estimation as a general APM principle identifies related-asset signals — Integrations, Databases, Servers, Software Licenses, Subscriptions, Leases, and similar — as the evidentiary basis for OoM scoring. Integrations and technology-profile diversity are the two most immediately actionable of these signals, because both are typically already captured in governed inventories — the Data Integrations Inventory and the Technologies Inventory — without requiring any new data collection effort. This chapter provides the worked methodology for using these two signals specifically.
Best Practice
Score every application’s integration complexity from the Data Integrations Inventory: count its total Integrations, and weight that count by protocol complexity (e.g., synchronous request-response versus asynchronous event-driven), integration criticality, and whether each integration is internal or crosses an external vendor boundary. Applications with a high weighted integration count carry proportionally more change, retirement, and operational complexity, and that relationship holds directionally even without a precise dollar cost attached to any single integration.
Score every application’s technology-profile diversity from the Technologies Inventory: count the distinct technologies in its stack — for example, the number of distinct database types in a persistence polyglot, the number of distinct platforms, or the number of distinct messaging technologies. An application spanning three database types carries more operational, migration, and retirement complexity than one built on a single database type, independent of any other factor, because each additional technology type adds its own skill set, runbook, and failure mode.
Combine the two signals into a single Order-of-Magnitude complexity and cost tier using a documented, repeatable combination rule — such as taking the higher of the two individual tiers, or a defined weighted formula — rather than an ad hoc judgment call for each application. Document the reasoning and confidence level behind every combined tier, consistent with the general OoM discipline established in the chapter this one extends, and refine specific applications’ tiers as better data becomes available.
Benefit(s)
Because Integration counts and Technology Profile attributes are typically already captured in governed inventories, this methodology produces defensible complexity and cost tiers for the full portfolio without requiring any new data collection effort — the signals are already on hand, and this chapter supplies the method for interpreting them. Applications that appear similar on the surface but differ sharply in integration count or technology diversity are correctly distinguished into different OoM tiers, surfacing complexity that a purely financial view would miss entirely for applications with no precise cost data. And because the combination rule is explicit and documented, the resulting tiers are defensible to stakeholders and repeatable as the portfolio and its underlying inventories evolve.
How to cite this page
When referencing this page in academic work, internal standards, or external publications, include the page title, IF4IT as author and publisher (The International Foundation for Information Technology (IF4IT), LLC), the URL, and your access date.
Example (informal web citation):
The International Foundation for Information Technology (IF4IT), LLC. Use Integration and Technology Diversity Signals to Derive Order-of-Magnitude Complexity and Cost Scores | Application Portfolio Management (APM) Best Practices. https://if4it.org/best-practices/application-portfolio-management-apm/use-integration-and-technology-diversity-signals-to-derive-order-of-magnitude-complexity-and-cost-scores/ (accessed 2026-10-22).
See About Us for content governance and site-wide citation guidance.
Copyright for The International Foundation for Information Technology (IF4IT), LLC: 2008 - Present
Legal Disclaimers